| Oracle® Database SQL Reference 10g Release 1 (10.1) Part Number B10759-01 |
|


|
View PDF |
| Oracle® Database SQL Reference 10g Release 1 (10.1) Part Number B10759-01 |
|
|
View PDF |
The linear regression functions are:
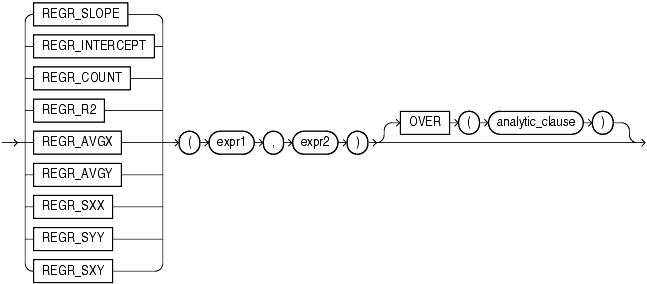
The linear regression functions fit an ordinary-least-squares regression line to a set of number pairs. You can use them as both aggregate and analytic functions.
|
See Also: "Aggregate Functions " and "About SQL Expressions " for information on valid forms ofexpr |
These functions take as arguments any numeric datatype or any nonnumeric datatype that can be implicitly converted to a numeric datatype. Oracle determines the argument with the highest numeric precedence, implicitly converts the remaining arguments to that datatype, and returns that datatype.
|
See Also: Table 2-11, "Implicit Type Conversion Matrix" for more information on implicit conversion and "Numeric Precedence " for information on numeric precedence |
Oracle applies the function to the set of (expr1, expr2) pairs after eliminating all pairs for which either expr1 or expr2 is null. Oracle computes all the regression functions simultaneously during a single pass through the data.
expr1 is interpreted as a value of the dependent variable (a y value), and expr2 is interpreted as a value of the independent variable (an x value).
REGR_SLOPE returns the slope of the line. The return value is a numeric datatype and can be null. After the elimination of null (expr1, expr2) pairs, it makes the following computation:
COVAR_POP(expr1, expr2) / VAR_POP(expr2)
REGR_INTERCEPT returns the y-intercept of the regression line. The return value is a numeric datatype and can be null. After the elimination of null (expr1, expr2) pairs, it makes the following computation:
AVG(expr1) - REGR_SLOPE(expr1, expr2) * AVG(expr2)
REGR_COUNT returns an integer that is the number of non-null number pairs used to fit the regression line.
REGR_R2 returns the coefficient of determination (also called R-squared or goodness of fit) for the regression. The return value is a numeric datatype and can be null. VAR_POP(expr1) and VAR_POP(expr2) are evaluated after the elimination of null pairs. The return values are:
NULL if VAR_POP(expr2)  = 0

                        1 if VAR_POP(expr1)  = 0 and
                             VAR_POP(expr2) != 0

POWER(CORR(expr1,expr),2) if VAR_POP(expr1)  > 0 and
                             VAR_POP(expr2  != 0
All of the remaining regression functions return a numeric datatype and can be null:
REGR_AVGX evaluates the average of the independent variable (expr2) of the regression line. It makes the following computation after the elimination of null (expr1, expr2) pairs:
AVG(expr2)
REGR_AVGY evaluates the average of the dependent variable (expr1) of the regression line. It makes the following computation after the elimination of null (expr1, expr2) pairs:
AVG(expr1)
REGR_SXY, REGR_SXX, REGR_SYY are auxiliary functions that are used to compute various diagnostic statistics.
REGR_SXX makes the following computation after the elimination of null (expr1, expr2) pairs:
REGR_COUNT(expr1, expr2) * VAR_POP(expr2)
REGR_SYY makes the following computation after the elimination of null (expr1, expr2) pairs:
REGR_COUNT(expr1, expr2) * VAR_POP(expr1)
REGR_SXY makes the following computation after the elimination of null (expr1, expr2) pairs:
REGR_COUNT(expr1, expr2) * COVAR_POP(expr1, expr2)
The following examples are based on the sample tables sh.sales and sh.products.
The following example provides a comparison of the various linear regression functions:
SELECT
s.channel_id,
REGR_SLOPE(s.quantity_sold, p.prod_list_price)  SLOPE ,
REGR_INTERCEPT(s.quantity_sold, p.prod_list_price)  INTCPT ,
REGR_R2(s.quantity_sold, p.prod_list_price)  RSQR ,
REGR_COUNT(s.quantity_sold, p.prod_list_price)  COUNT ,
REGR_AVGX(s.quantity_sold, p.prod_list_price)  AVGLISTP ,
REGR_AVGY(s.quantity_sold, p.prod_list_price)  AVGQSOLD
FROM  sales s, products p
WHERE s.prod_id=p.prod_id AND
p.prod_category='Men'  AND
s.time_id=to_DATE('10-OCT-2000')
GROUP BY s.channel_id;

C      SLOPE     INTCPT       RSQR      COUNT   AVGLISTP   AVGQSOLD
- ---------- ---------- ---------- ---------- ---------- ----------
C -.03529838 16.4548382 .217277422         17 87.8764706 13.3529412
I  -.0108044 13.3082392 .028398018         43  116.77907 12.0465116
P -.01729665 11.3634927 .026191191         33 80.5818182 9.96969697
S -.01277499  13.488506 .000473089         71  52.571831 12.8169014
T -.01026734 5.01019929 .064283727         21       75.2 4.23809524
The following example determines the slope and intercept of the regression line for the amount of sales and sale profits for each fiscal year:
SELECT t.fiscal_year,
   REGR_SLOPE(s.amount_sold, s.quantity_sold) "Slope",
   REGR_INTERCEPT(s.amount_sold, s.quantity_sold) "Intercept"
   FROM sales s, times t
   WHERE s.time_id = t.time_id
   GROUP BY t.fiscal_year;

FISCAL_YEAR      Slope  Intercept
----------- ---------- ----------
       1998 49.3934247 71.6015479
       1999 49.3443482 70.1502601
       2000 49.2262135 75.0287476
The following example determines the cumulative slope and cumulative intercept of the regression line for the amount of and quantity of sales for two products (270 and 260) for weekend transactions (day_number_in_week = 6 or 7) during the last three weeks (fiscal_week_number of 50, 51, or 52) of 1998:
SELECT t.fiscal_month_number "Month", t.day_number_in_month "Day",
   REGR_SLOPE(s.amount_sold, s.quantity_sold)
      OVER (ORDER BY t.fiscal_month_desc, t.day_number_in_month) AS CUM_SLOPE,
   REGR_INTERCEPT(s.amount_sold, s.quantity_sold)
      OVER (ORDER BY t.fiscal_month_desc, t.day_number_in_month) AS CUM_ICPT
   FROM sales s, times t
   WHERE s.time_id = t.time_id
      AND s.prod_id IN (270, 260)
      AND t.fiscal_year=1998
      AND t.fiscal_week_number IN (50, 51, 52)
      AND t.day_number_in_week IN (6,7)
   ORDER BY t.fiscal_month_desc, t.day_number_in_month;
Month        Day  CUM_SLOPE   CUM_ICPT
---------- ---------- ---------- ----------
        12         12        -68       1872
        12         12        -68       1872
        12         13 -20.244898 1254.36735
        12         13 -20.244898 1254.36735
        12         19 -18.826087       1287
        12         20 62.4561404  125.28655
        12         20 62.4561404  125.28655
        12         20 62.4561404  125.28655
        12         20 62.4561404  125.28655
        12         26 67.2658228 58.9712313
        12         26 67.2658228 58.9712313
        12         27 37.5245541 284.958221
        12         27 37.5245541 284.958221
        12         27 37.5245541 284.958221
The following example returns the number of customers in the customers table (out of a total of 319) who have account managers.
SELECT REGR_COUNT(customer_id, account_mgr_id) FROM customers;

REGR_COUNT(CUSTOMER_ID,ACCOUNT_MGR_ID)
--------------------------------------
                                   231
The following example computes the cumulative number of transactions for each day in April of 1998:
SELECT UNIQUE t.day_number_in_month,
   REGR_COUNT(s.amount_sold, s.quantity_sold)
      OVER (PARTITION BY t.fiscal_month_number
   ORDER BY t.day_number_in_month) "Regr_Count"
FROM sales s, times t
WHERE s.time_id = t.time_id
AND t.fiscal_year = 1998 AND t.fiscal_month_number = 4;

DAY_NUMBER_IN_MONTH Regr_Count
------------------- ----------
                  1        825
                  2       1650
                  3       2475
                  4       3300
. . .
                 26      21450
                 30      22200
The following example computes the coefficient of determination of the regression line for amount of sales greater than 5000 and quantity sold:
SELECT REGR_R2(amount_sold, quantity_sold) FROM sales
   WHERE amount_sold > 5000;

REGR_R2(AMOUNT_SOLD,QUANTITY_SOLD)
----------------------------------
                        .024087453
The following example computes the cumulative coefficient of determination of the regression line for monthly sales amounts and quantities for each month during 1998:
SELECT t.fiscal_month_number,
      REGR_R2(SUM(s.amount_sold), SUM(s.quantity_sold))
      OVER (ORDER BY t.fiscal_month_number) "Regr_R2"
   FROM sales s, times t
   WHERE s.time_id = t.time_id
   AND t.fiscal_year = 1998
   GROUP BY t.fiscal_month_number
   ORDER BY t.fiscal_month_number;

FISCAL_MONTH_NUMBER    Regr_R2
------------------- ----------
                  1
                  2          1
                  3 .927372984
                  4 .807019972
                  5 .932745567
                  6  .94682861
                  7 .965342011
                  8 .955768075
                  9 .959542618
                 10 .938618575
                 11 .880931415
                 12 .882769189
The following example calculates the regression average for the amount and quantity of sales for each year:
SELECT t.fiscal_year,
   REGR_AVGY(s.amount_sold, s.quantity_sold) "Regr_AvgY",
   REGR_AVGX(s.amount_sold, s.quantity_sold) "Regr_AvgX"
FROM sales s, times t
WHERE s.time_id = t.time_id
GROUP BY t.fiscal_year;

FISCAL_YEAR  Regr_AvgY  Regr_AvgX
----------- ---------- ----------
       1998 716.602044 13.0584283
       1999 714.910831 13.0665536
       2000 717.331304 13.0479781
The following example calculates the cumulative averages for the amount and quantity of sales profits for product 260 during the last two weeks of December 1998:
SELECT t.day_number_in_month,
   REGR_AVGY(s.amount_sold, s.quantity_sold)
      OVER (ORDER BY t.fiscal_month_desc, t.day_number_in_month)
      "Regr_AvgY",
   REGR_AVGX(s.amount_sold, s.quantity_sold)
      OVER (ORDER BY t.fiscal_month_desc, t.day_number_in_month)
      "Regr_AvgX"
   FROM sales s, times t
   WHERE s.time_id = t.time_id
      AND s.prod_id = 260
      AND t.fiscal_month_desc = '1998-12'
      AND t.fiscal_week_number IN (51, 52)
   ORDER BY t.day_number_in_month;

DAY_NUMBER_IN_MONTH  Regr_AvgY  Regr_AvgX
------------------- ---------- ----------
                 14        882       24.5
                 14        882       24.5
                 15        801      22.25
                 15        801      22.25
                 16      777.6       21.6
                 18 642.857143 17.8571429
                 18 642.857143 17.8571429
                 20      589.5     16.375
                 21        544 15.1111111
                 22 592.363636 16.4545455
                 22 592.363636 16.4545455
                 24 553.846154 15.3846154
                 24 553.846154 15.3846154
                 26        522       14.5
                 27      578.4 16.0666667
The following example computes the REGR_SXY, REGR_SXX, and REGR_SYY values for the regression analysis of amount and quantity of sales for each year in the sample sh.sales table:
SELECT t.fiscal_year,
   REGR_SXY(s.amount_sold, s.quantity_sold) "Regr_sxy",
   REGR_SYY(s.amount_sold, s.quantity_sold) "Regr_syy",
   REGR_SXX(s.amount_sold, s.quantity_sold) "Regr_sxx"
FROM sales s, times t
WHERE s.time_id = t.time_id
GROUP BY t.fiscal_year;

FISCAL_YEAR   Regr_sxy   Regr_syy   Regr_sxx
----------- ---------- ---------- ----------
       1998 1620591607 2.3328E+11 32809865.2
       1999 1955866724 2.7695E+11 39637097.2
       2000 2127877398 3.0630E+11 43226509.7
The following example computes the cumulative REGR_SXY, REGR_SXX, and REGR_SYY statistics for amount and quantity of weekend sales for products 270 and 260 for each year-month value in 1998:
SELECT t.day_number_in_month,
   REGR_SXY(s.amount_sold, s.quantity_sold)
      OVER (ORDER BY t.fiscal_year, t.fiscal_month_desc) "Regr_sxy",
   REGR_SYY(s.amount_sold, s.quantity_sold)
      OVER (ORDER BY t.fiscal_year, t.fiscal_month_desc) "Regr_syy",
   REGR_SXX(s.amount_sold, s.quantity_sold)
      OVER (ORDER BY t.fiscal_year, t.fiscal_month_desc) "Regr_sxx"
FROM sales s, times t
WHERE s.time_id = t.time_id
   AND prod_id IN (270, 260)
   AND t.fiscal_month_desc = '1998-02'
   AND t.day_number_in_week IN (6,7)
ORDER BY t.day_number_in_month;

DAY_NUMBER_IN_MONTH   Regr_sxy   Regr_syy   Regr_sxx
------------------- ---------- ---------- ----------
                  1  130973783 1.8916E+10 2577797.94
. . .
                 30  130973783 1.8916E+10 2577797.94
|
 Copyright © 1996, 2003 Oracle Corporation All Rights Reserved. |
|

