
Pima (20% of outliers version#04)
The data set contains medical data on diabetes. Patients suffering from diabetes were considered outliers.
Download all data set variants used (694.8 kB). You can also access the original data. (pima-indians-diabetes.data)
Normalized, without duplicates
This version contains 8 attributes, 625 objects, 125 outliers (20.00%)
Download raw algorithm results (5.5 MB) Download raw algorithm evaluation table (54.3 kB)
Best Parameters
The following table contains the best
(overall and per-method)
results for each method and evaluation measure (when the same score was achieved twice, only the smallest k is given).
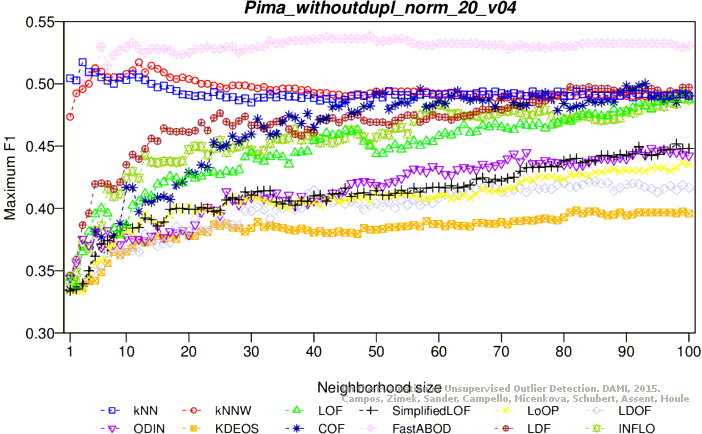
The Maximum F1-Measure is complimentary in addition to the measures in the original publication.
| Algorithm | k | P@n | Adj. P@n | AP | Adj. AP | Max-F1 | Adj. MF1 | ROC AUC |
|---|---|---|---|---|---|---|---|---|
| KNN | 1 | 0.44800 | 0.31000 | 0.39840 | 0.24800 | 0.50450 | 0.38063 | 0.74356 |
| KNN | 2 | 0.44800 | 0.31000 | 0.40025 | 0.25031 | 0.50279 | 0.37849 | 0.75458 |
| KNN | 3 | 0.43200 | 0.29000 | 0.39571 | 0.24464 | 0.51744 | 0.39680 | 0.75576 |
| KNN | 62 | 0.38400 | 0.23000 | 0.37996 | 0.22495 | 0.49284 | 0.36605 | 0.75730 |
| KNNW | 3 | 0.43200 | 0.29000 | 0.39992 | 0.24990 | 0.49577 | 0.36972 | 0.74526 |
| KNNW | 5 | 0.46400 | 0.33000 | 0.39742 | 0.24677 | 0.51253 | 0.39067 | 0.75395 |
| KNNW | 12 | 0.41600 | 0.27000 | 0.39228 | 0.24035 | 0.51733 | 0.39667 | 0.75464 |
| KNNW | 99 | 0.38400 | 0.23000 | 0.38347 | 0.22934 | 0.49140 | 0.36425 | 0.75640 |
| LOF | 88 | 0.39200 | 0.24000 | 0.34367 | 0.17959 | 0.47956 | 0.34946 | 0.73299 |
| LOF | 99 | 0.39200 | 0.24000 | 0.34857 | 0.18571 | 0.49162 | 0.36453 | 0.73968 |
| LOF | 100 | 0.39200 | 0.24000 | 0.34971 | 0.18713 | 0.48739 | 0.35924 | 0.74045 |
| SimplifiedLOF | 80 | 0.36000 | 0.20000 | 0.31105 | 0.13881 | 0.43820 | 0.29775 | 0.68331 |
| SimplifiedLOF | 98 | 0.35200 | 0.19000 | 0.31674 | 0.14592 | 0.45179 | 0.31474 | 0.69154 |
| SimplifiedLOF | 100 | 0.35200 | 0.19000 | 0.31818 | 0.14773 | 0.44809 | 0.31011 | 0.69282 |
| LoOP | 87 | 0.36800 | 0.21000 | 0.31171 | 0.13963 | 0.43023 | 0.28779 | 0.68193 |
| LoOP | 99 | 0.36000 | 0.20000 | 0.31339 | 0.14173 | 0.43658 | 0.29572 | 0.68434 |
| LoOP | 100 | 0.36000 | 0.20000 | 0.31454 | 0.14317 | 0.43529 | 0.29412 | 0.68542 |
| LDOF | 48 | 0.36800 | 0.21000 | 0.29865 | 0.12331 | 0.39907 | 0.24884 | 0.65646 |
| LDOF | 75 | 0.35200 | 0.19000 | 0.30767 | 0.13458 | 0.41784 | 0.27230 | 0.66867 |
| LDOF | 76 | 0.35200 | 0.19000 | 0.30834 | 0.13542 | 0.41570 | 0.26963 | 0.66754 |
| LDOF | 85 | 0.35200 | 0.19000 | 0.30809 | 0.13511 | 0.42155 | 0.27693 | 0.66672 |
| ODIN | 46 | 0.37227 | 0.21533 | 0.31151 | 0.13938 | 0.42029 | 0.27536 | 0.66826 |
| ODIN | 94 | 0.36457 | 0.20571 | 0.32657 | 0.15821 | 0.44828 | 0.31034 | 0.70343 |
| ODIN | 100 | 0.36400 | 0.20500 | 0.32941 | 0.16177 | 0.44226 | 0.30283 | 0.70829 |
| FastABOD | 25 | 0.50400 | 0.38000 | 0.44055 | 0.30068 | 0.52817 | 0.41021 | 0.77432 |
| FastABOD | 42 | 0.48800 | 0.36000 | 0.44997 | 0.31247 | 0.53818 | 0.42273 | 0.78062 |
| FastABOD | 100 | 0.48800 | 0.36000 | 0.46243 | 0.32803 | 0.53047 | 0.41308 | 0.78802 |
| KDEOS | 14 | 0.28000 | 0.10000 | 0.23998 | 0.04998 | 0.37351 | 0.21689 | 0.57544 |
| KDEOS | 82 | 0.22400 | 0.03000 | 0.24309 | 0.05387 | 0.39836 | 0.24795 | 0.60941 |
| KDEOS | 100 | 0.22400 | 0.03000 | 0.24381 | 0.05477 | 0.39588 | 0.24485 | 0.61445 |
| LDF | 54 | 0.41600 | 0.27000 | 0.34825 | 0.18531 | 0.47293 | 0.34117 | 0.72611 |
| LDF | 81 | 0.40000 | 0.25000 | 0.37165 | 0.21456 | 0.49744 | 0.37179 | 0.75254 |
| LDF | 100 | 0.39200 | 0.24000 | 0.37973 | 0.22466 | 0.49714 | 0.37143 | 0.76077 |
| INFLO | 79 | 0.37600 | 0.22000 | 0.32843 | 0.16053 | 0.46862 | 0.33577 | 0.70313 |
| INFLO | 97 | 0.36800 | 0.21000 | 0.33372 | 0.16714 | 0.48498 | 0.35622 | 0.71211 |
| INFLO | 99 | 0.36000 | 0.20000 | 0.33369 | 0.16711 | 0.48812 | 0.36015 | 0.71182 |
| COF | 93 | 0.43200 | 0.29000 | 0.42308 | 0.27885 | 0.50000 | 0.37500 | 0.75120 |
| COF | 98 | 0.44800 | 0.31000 | 0.44402 | 0.30503 | 0.48529 | 0.35662 | 0.75507 |
| COF | 99 | 0.47200 | 0.34000 | 0.44237 | 0.30296 | 0.49242 | 0.36553 | 0.75592 |
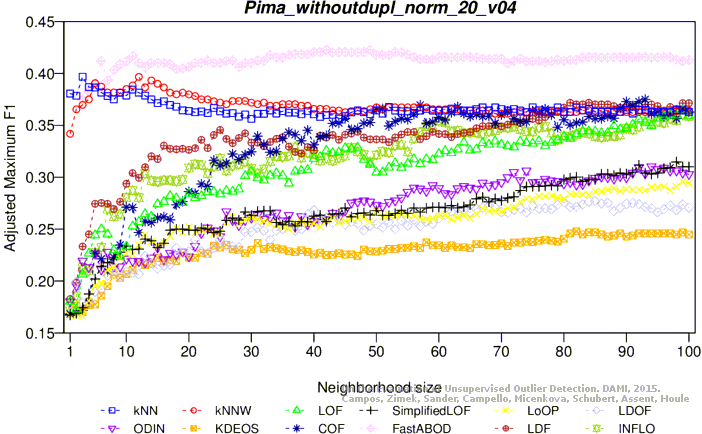
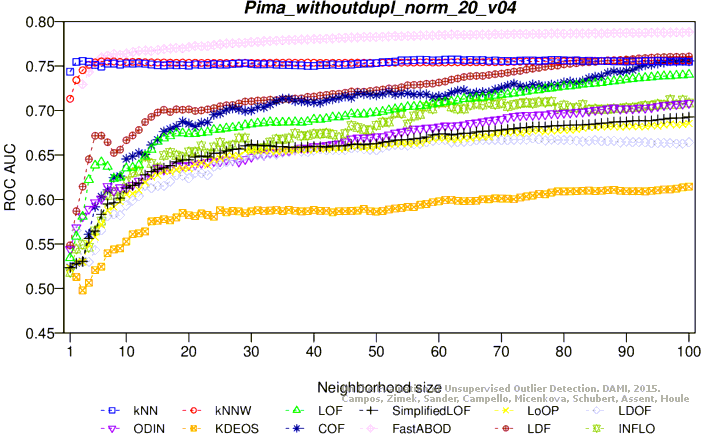
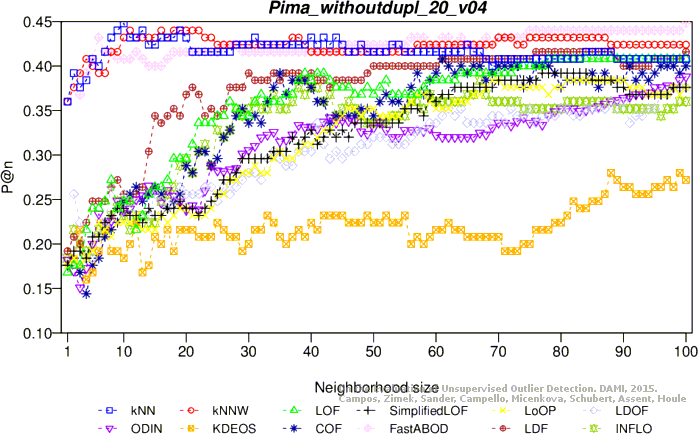
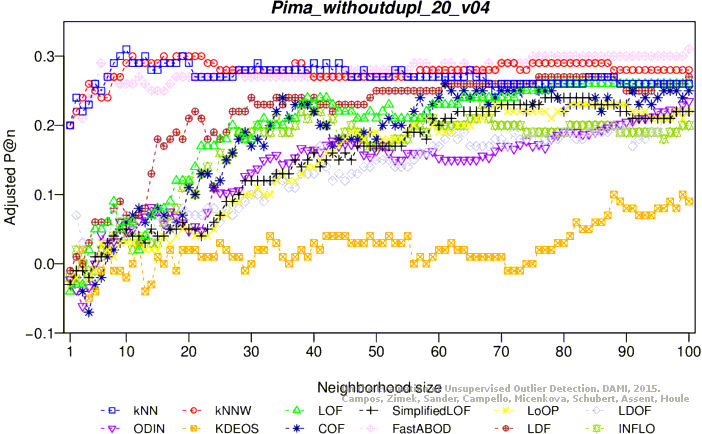
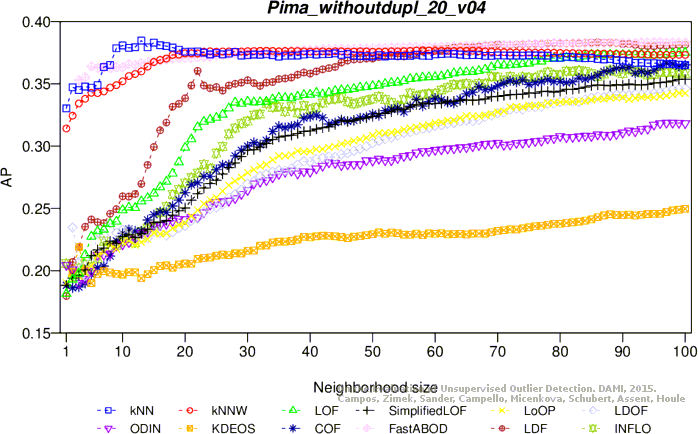
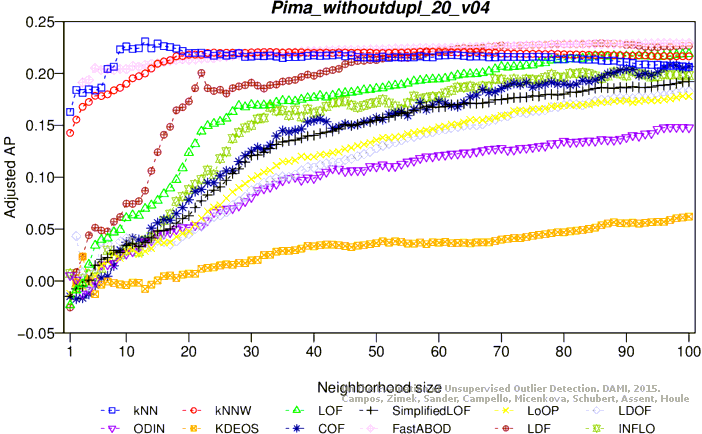
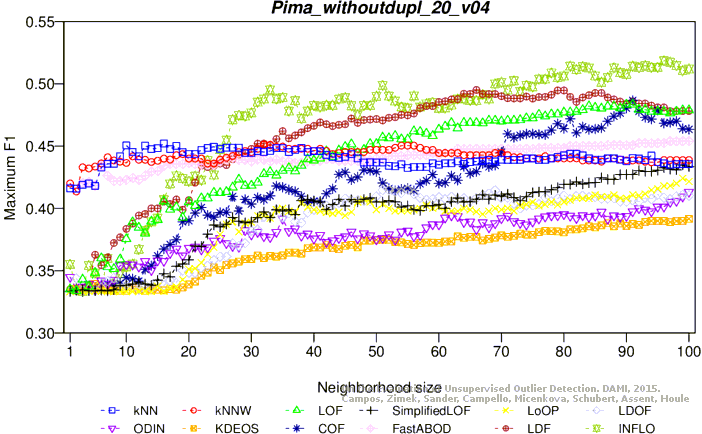
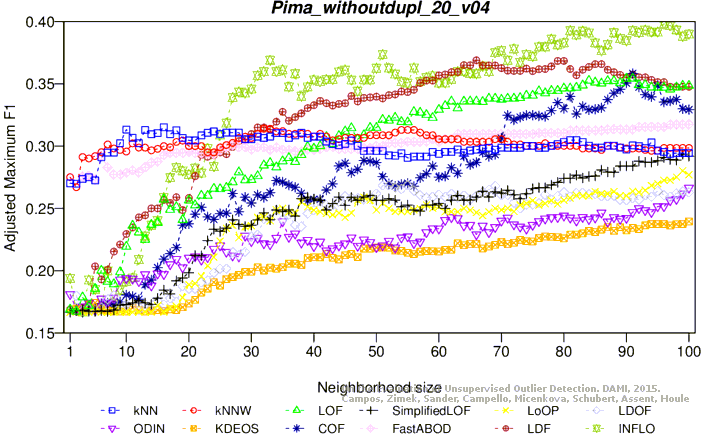
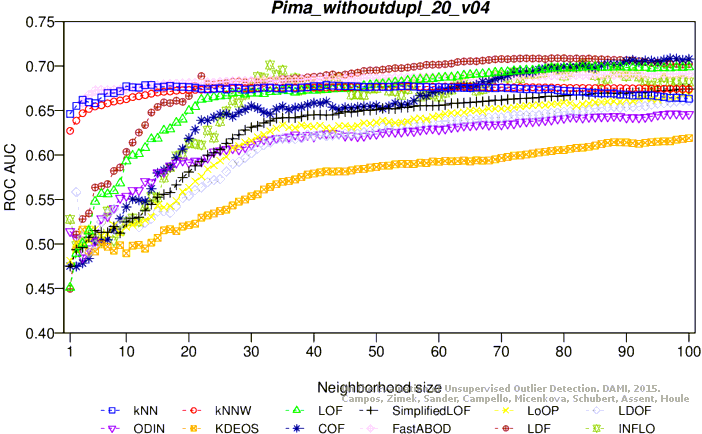
Plots
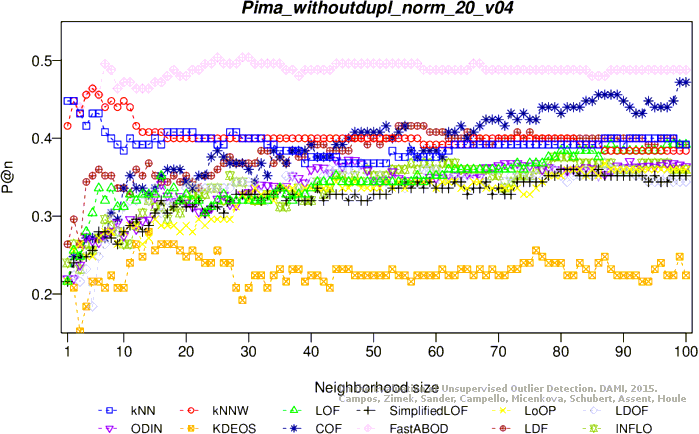
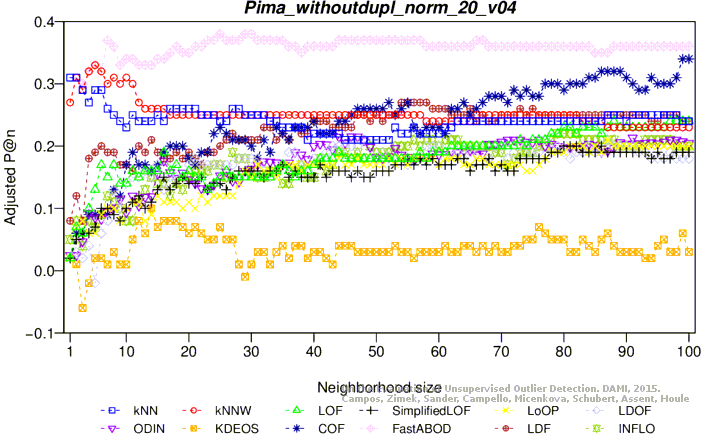
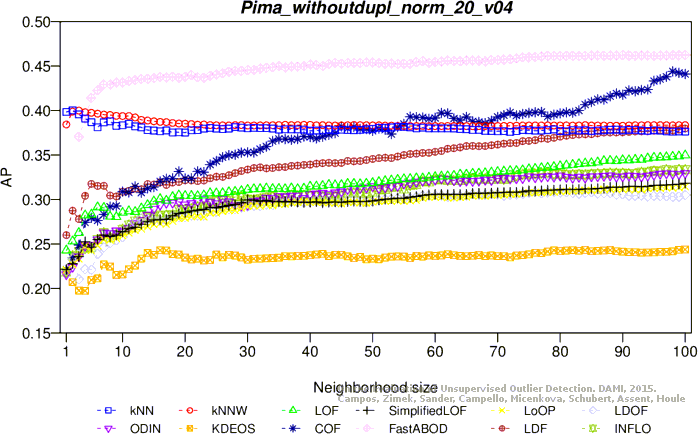
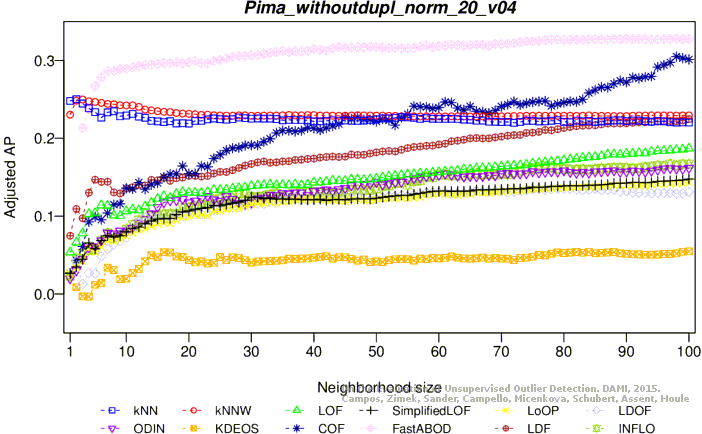
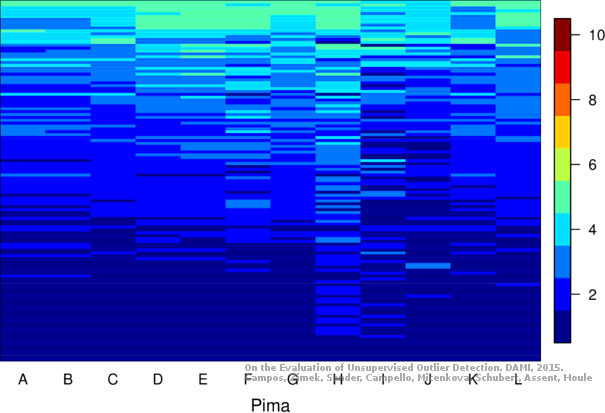
G: ODIN, H: KDEOS, I: COF, J: FastABOD, K: LDF, L: INFLO
Not normalized, without duplicates
This version contains 8 attributes, 625 objects, 125 outliers (20.00%)
Download raw algorithm results (5.4 MB) Download raw algorithm evaluation table (54.9 kB)
Best Parameters
The following table contains the best
(overall and per-method)
results for each method and evaluation measure (when the same score was achieved twice, only the smallest k is given).
The Maximum F1-Measure is complimentary in addition to the measures in the original publication.
| Algorithm | k | P@n | Adj. P@n | AP | Adj. AP | Max-F1 | Adj. MF1 | ROC AUC |
|---|---|---|---|---|---|---|---|---|
| KNN | 10 | 0.44800 | 0.31000 | 0.38082 | 0.22602 | 0.45059 | 0.31324 | 0.67725 |
| KNN | 13 | 0.44000 | 0.30000 | 0.38476 | 0.23095 | 0.45038 | 0.31298 | 0.67851 |
| KNN | 14 | 0.42400 | 0.28000 | 0.37939 | 0.22423 | 0.44765 | 0.30957 | 0.67882 |
| KNN | 16 | 0.43200 | 0.29000 | 0.38104 | 0.22630 | 0.45211 | 0.31513 | 0.67678 |
| KNNW | 11 | 0.44000 | 0.30000 | 0.35626 | 0.19533 | 0.44177 | 0.30221 | 0.66504 |
| KNNW | 32 | 0.42400 | 0.28000 | 0.37653 | 0.22067 | 0.45113 | 0.31391 | 0.67566 |
| KNNW | 58 | 0.42400 | 0.28000 | 0.37691 | 0.22114 | 0.44697 | 0.30871 | 0.67701 |
| LOF | 78 | 0.40800 | 0.26000 | 0.37007 | 0.21258 | 0.47557 | 0.34446 | 0.69747 |
| LOF | 85 | 0.40800 | 0.26000 | 0.37345 | 0.21681 | 0.48094 | 0.35117 | 0.69907 |
| LOF | 90 | 0.40800 | 0.26000 | 0.37331 | 0.21664 | 0.48338 | 0.35423 | 0.69834 |
| LOF | 100 | 0.40800 | 0.26000 | 0.37505 | 0.21882 | 0.47887 | 0.34859 | 0.69880 |
| SimplifiedLOF | 77 | 0.39200 | 0.24000 | 0.34372 | 0.17965 | 0.41330 | 0.26663 | 0.66576 |
| SimplifiedLOF | 99 | 0.37600 | 0.22000 | 0.35355 | 0.19194 | 0.43478 | 0.29348 | 0.67422 |
| SimplifiedLOF | 100 | 0.37600 | 0.22000 | 0.35368 | 0.19211 | 0.43350 | 0.29187 | 0.67414 |
| LoOP | 69 | 0.38400 | 0.23000 | 0.32590 | 0.15738 | 0.40000 | 0.25000 | 0.65203 |
| LoOP | 99 | 0.36800 | 0.21000 | 0.34255 | 0.17819 | 0.42410 | 0.28012 | 0.66819 |
| LDOF | 51 | 0.32000 | 0.15000 | 0.30418 | 0.13023 | 0.41477 | 0.26847 | 0.63133 |
| LDOF | 98 | 0.37600 | 0.22000 | 0.34524 | 0.18155 | 0.40957 | 0.26197 | 0.66022 |
| LDOF | 100 | 0.37600 | 0.22000 | 0.34609 | 0.18261 | 0.41026 | 0.26282 | 0.66117 |
| ODIN | 97 | 0.37800 | 0.22250 | 0.31862 | 0.14828 | 0.40506 | 0.25633 | 0.64643 |
| ODIN | 98 | 0.37600 | 0.22000 | 0.31860 | 0.14825 | 0.40588 | 0.25735 | 0.64645 |
| ODIN | 100 | 0.38800 | 0.23500 | 0.31827 | 0.14784 | 0.41317 | 0.26647 | 0.64591 |
| FastABOD | 97 | 0.44000 | 0.30000 | 0.38336 | 0.22921 | 0.45390 | 0.31738 | 0.69107 |
| FastABOD | 100 | 0.44800 | 0.31000 | 0.38323 | 0.22904 | 0.45390 | 0.31738 | 0.69130 |
| KDEOS | 88 | 0.28000 | 0.10000 | 0.24533 | 0.05666 | 0.38559 | 0.23199 | 0.61442 |
| KDEOS | 100 | 0.27200 | 0.09000 | 0.24964 | 0.06206 | 0.39158 | 0.23947 | 0.61896 |
| LDF | 66 | 0.40800 | 0.26000 | 0.37920 | 0.22399 | 0.49511 | 0.36889 | 0.70531 |
| LDF | 76 | 0.41600 | 0.27000 | 0.38214 | 0.22767 | 0.48936 | 0.36170 | 0.70850 |
| LDF | 80 | 0.41600 | 0.27000 | 0.38243 | 0.22803 | 0.49470 | 0.36837 | 0.70877 |
| LDF | 86 | 0.41600 | 0.27000 | 0.38343 | 0.22929 | 0.49265 | 0.36581 | 0.70758 |
| INFLO | 67 | 0.38400 | 0.23000 | 0.35036 | 0.18795 | 0.49132 | 0.36414 | 0.67359 |
| INFLO | 83 | 0.36000 | 0.20000 | 0.36071 | 0.20089 | 0.51385 | 0.39232 | 0.70202 |
| INFLO | 91 | 0.35200 | 0.19000 | 0.36163 | 0.20204 | 0.51414 | 0.39267 | 0.69213 |
| INFLO | 96 | 0.34400 | 0.18000 | 0.35929 | 0.19911 | 0.51852 | 0.39815 | 0.68694 |
| COF | 61 | 0.40800 | 0.26000 | 0.33711 | 0.17138 | 0.42066 | 0.27583 | 0.67343 |
| COF | 91 | 0.40000 | 0.25000 | 0.36298 | 0.20373 | 0.48665 | 0.35831 | 0.70666 |
| COF | 97 | 0.40000 | 0.25000 | 0.36652 | 0.20815 | 0.46900 | 0.33625 | 0.70846 |
Plots
G: ODIN, H: KDEOS, I: COF, J: FastABOD, K: LDF, L: INFLO