
WPBC
This dataset is available in UCI as Wisconsin Prognostic Breast Cancer (WPBC). In this version (HiCS, [1]), the authors use the class R (minority) as outlier and class N as inlier. The processed database has 33 numerical attributes and 198 instances, 47 outliers (23.74%) and 151 inliers (76.26%).
References:
[1] F. Keller, E. Mueller, and K. Boehm. HiCS: high contrast subspaces for density-based outlier ranking. In Proc. ICDE, 2012.
Download all data set variants used (40.9 kB). You can also access the original data. (real world datasets)
Normalized, without duplicates
This version contains 33 attributes, 198 objects, 47 outliers (23.74%)
Download raw algorithm results (1.7 MB) Download raw algorithm evaluation table (55.4 kB)
Best Parameters
The following table contains the best
(overall and per-method)
results for each method and evaluation measure (when the same score was achieved twice, only the smallest k is given).
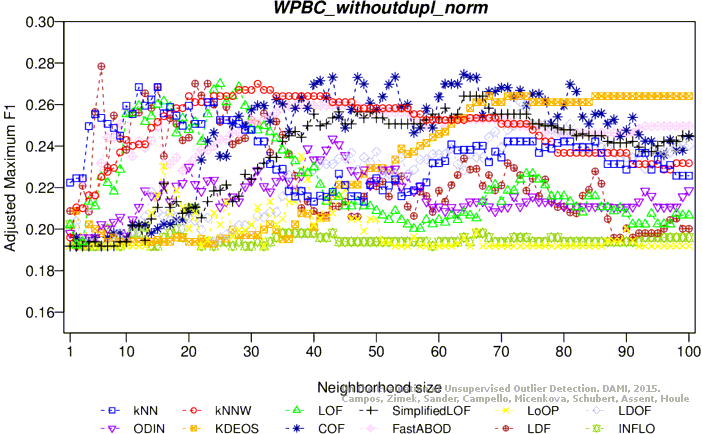
The Maximum F1-Measure is complimentary in addition to the measures in the original publication.
| Algorithm | k | P@n | Adj. P@n | AP | Adj. AP | Max-F1 | Adj. MF1 | ROC AUC |
|---|---|---|---|---|---|---|---|---|
| KNN | 12 | 0.19149 | -0.06017 | 0.24430 | 0.00909 | 0.44211 | 0.26846 | 0.54093 |
| KNN | 88 | 0.21277 | -0.03227 | 0.23794 | 0.00075 | 0.41379 | 0.23133 | 0.50585 |
| KNNW | 9 | 0.19149 | -0.06017 | 0.23212 | -0.00688 | 0.41808 | 0.23695 | 0.51952 |
| KNNW | 18 | 0.19149 | -0.06017 | 0.23776 | 0.00050 | 0.43434 | 0.25828 | 0.53191 |
| KNNW | 30 | 0.19149 | -0.06017 | 0.23897 | 0.00210 | 0.44103 | 0.26704 | 0.52966 |
| KNNW | 31 | 0.19149 | -0.06017 | 0.23874 | 0.00180 | 0.44330 | 0.27002 | 0.52924 |
| LOF | 12 | 0.21277 | -0.03227 | 0.23095 | -0.00842 | 0.43523 | 0.25944 | 0.52050 |
| LOF | 24 | 0.19149 | -0.06017 | 0.23369 | -0.00483 | 0.44103 | 0.26704 | 0.52543 |
| LOF | 25 | 0.19149 | -0.06017 | 0.23331 | -0.00533 | 0.44330 | 0.27002 | 0.52431 |
| SimplifiedLOF | 1 | 0.21277 | -0.03227 | 0.23003 | -0.00964 | 0.38367 | 0.19184 | 0.50183 |
| SimplifiedLOF | 2 | 0.17021 | -0.08807 | 0.24207 | 0.00616 | 0.38367 | 0.19184 | 0.46189 |
| SimplifiedLOF | 64 | 0.17021 | -0.08807 | 0.22813 | -0.01212 | 0.43878 | 0.26409 | 0.49683 |
| LoOP | 1 | 0.21277 | -0.03227 | 0.23003 | -0.00964 | 0.38367 | 0.19184 | 0.50183 |
| LoOP | 2 | 0.17021 | -0.08807 | 0.24961 | 0.01604 | 0.38367 | 0.19184 | 0.47619 |
| LoOP | 38 | 0.19149 | -0.06017 | 0.22251 | -0.01949 | 0.41667 | 0.23510 | 0.49084 |
| LDOF | 2 | 0.27660 | 0.05143 | 0.26484 | 0.03601 | 0.39286 | 0.20388 | 0.50007 |
| LDOF | 73 | 0.17021 | -0.08807 | 0.23196 | -0.00709 | 0.43655 | 0.26117 | 0.50345 |
| ODIN | 1 | 0.24706 | 0.01270 | 0.24163 | 0.00558 | 0.38843 | 0.19807 | 0.50726 |
| ODIN | 43 | 0.17021 | -0.08807 | 0.22277 | -0.01915 | 0.42308 | 0.24350 | 0.48048 |
| FastABOD | 3 | 0.21277 | -0.03227 | 0.24875 | 0.01491 | 0.40816 | 0.22395 | 0.52670 |
| FastABOD | 35 | 0.17021 | -0.08807 | 0.23906 | 0.00221 | 0.43529 | 0.25952 | 0.53036 |
| FastABOD | 40 | 0.17021 | -0.08807 | 0.24085 | 0.00456 | 0.43529 | 0.25952 | 0.53417 |
| KDEOS | 2 | 0.23404 | -0.00437 | 0.28079 | 0.05693 | 0.39662 | 0.20882 | 0.51853 |
| KDEOS | 3 | 0.29787 | 0.07933 | 0.28670 | 0.06467 | 0.38411 | 0.19240 | 0.51726 |
| KDEOS | 68 | 0.17021 | -0.08807 | 0.23497 | -0.00315 | 0.43878 | 0.26409 | 0.49556 |
| LDF | 6 | 0.12766 | -0.14386 | 0.23642 | -0.00125 | 0.44970 | 0.27842 | 0.53206 |
| LDF | 7 | 0.27660 | 0.05143 | 0.26122 | 0.03127 | 0.41250 | 0.22964 | 0.56559 |
| LDF | 8 | 0.27660 | 0.05143 | 0.27129 | 0.04447 | 0.43165 | 0.25475 | 0.58292 |
| INFLO | 2 | 0.21277 | -0.03227 | 0.26116 | 0.03119 | 0.38655 | 0.19561 | 0.48838 |
| INFLO | 11 | 0.23404 | -0.00437 | 0.22319 | -0.01859 | 0.38843 | 0.19807 | 0.47090 |
| INFLO | 20 | 0.21277 | -0.03227 | 0.22405 | -0.01747 | 0.39759 | 0.21009 | 0.49570 |
| COF | 64 | 0.19149 | -0.06017 | 0.24037 | 0.00393 | 0.44681 | 0.27462 | 0.54615 |
| COF | 73 | 0.23404 | -0.00437 | 0.24525 | 0.01033 | 0.44086 | 0.26682 | 0.55319 |
| COF | 97 | 0.23404 | -0.00437 | 0.25331 | 0.02090 | 0.42268 | 0.24298 | 0.55686 |
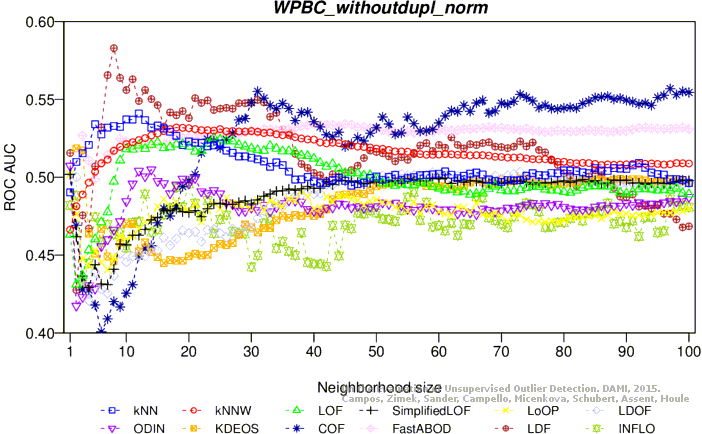
Plots

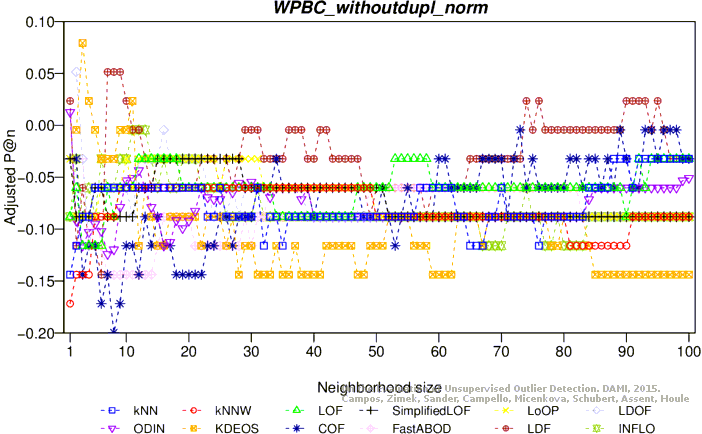
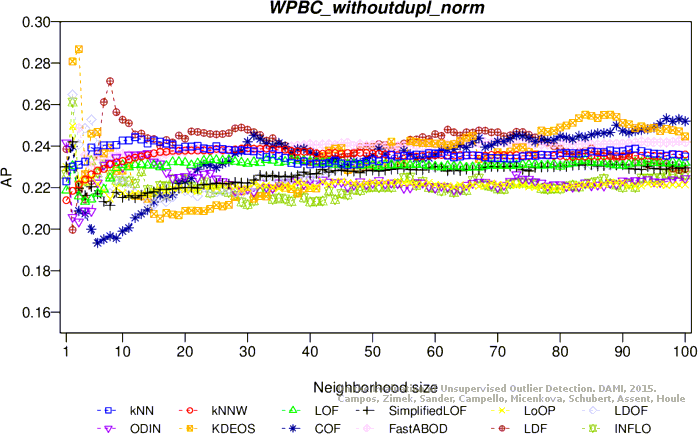
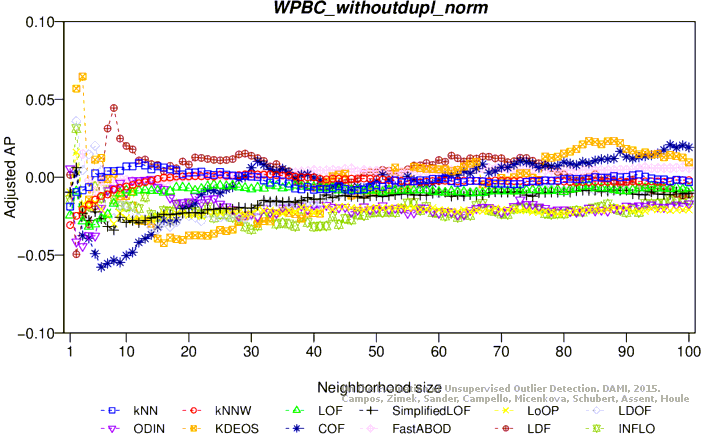
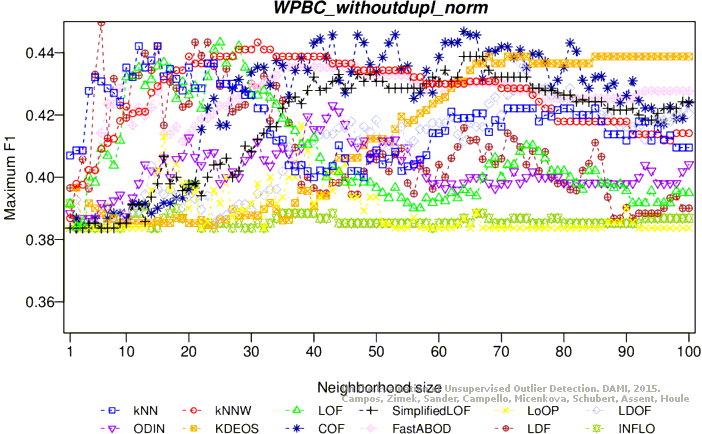
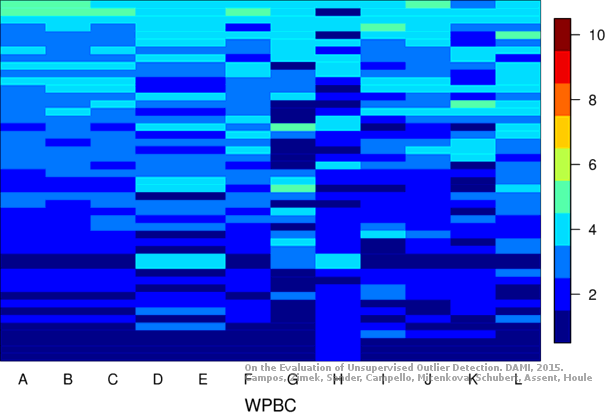
G: ODIN, H: KDEOS, I: COF, J: FastABOD, K: LDF, L: INFLO