
WBC (version#04)
This dataset consists of examples of different cancer types, benign or malignant. Examples of benign cancer are considered inliers, examples of malignant cancer are considered outliers. After downsampling the outliers, following Schubert et al. [1], 10 outliers remain. 234 instances are duplicates (231 inliers and 3 outliers), therefore 229 outliers were removed from the data set with duplicates and 226 outliers from the dataset without duplicates. Furthermore, we removed 16 instances with missing values, two of them being outliers and 14 inliers. The processed data set has 9 numeric attributes and 454 instances, namely 10 outliers (2.2%) and 444 inliers (97.8%). The same pre-processing has also been applied in [2] and [3].
References:
[1] E. Schubert, R. Wojdanowski, A. Zimek, and H.-P. Kriegel.
On evaluation of outlier rankings and outlier scores. In Proc.
SDM, pages 1047-1058, 2012.
[2] A. Zimek, M. Gaudet, R. J. G. B. Campello, and J. Sander.
Subsampling for efficient and effective unsupervised outlier
detection ensembles. In Proc. KDD, pages 428-436, 2013.
[3] H.-P. Kriegel, P. Kroeger, E. Schubert, and A. Zimek.
Interpreting and unifying outlier scores. In Proc. SDM, pages
13-24, 2011.
Download all data set variants used (57.1 kB). You can also access the original data. (breast-cancer-wisconsin.data)
- Normalized, without duplicates
- Normalized, duplicates
- Not normalized, without duplicates
- Not normalized, duplicates
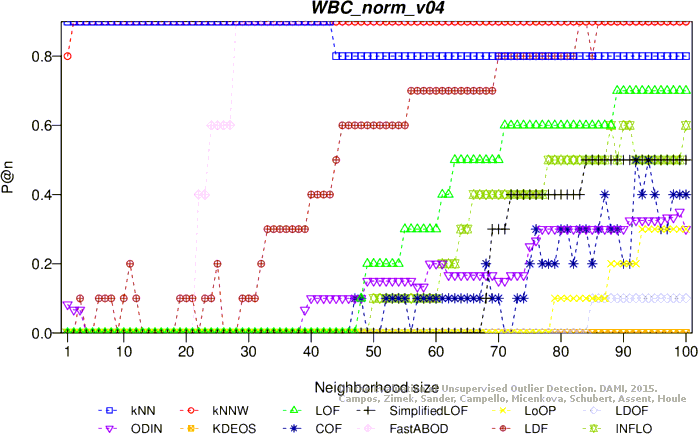
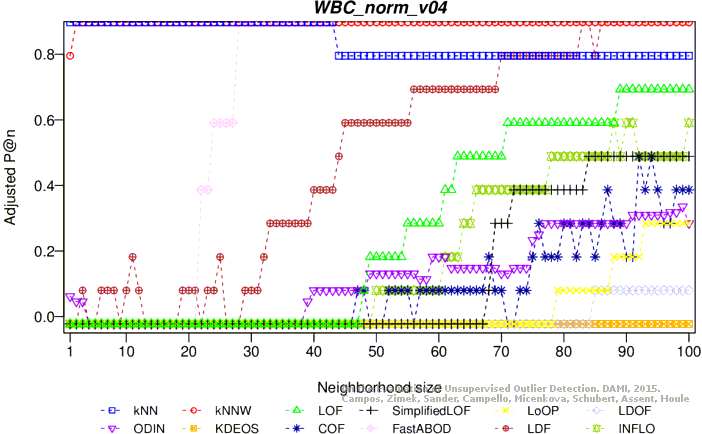
Normalized, without duplicates
This version contains 9 attributes, 223 objects, 10 outliers (4.48%)
Download raw algorithm results (1.6 MB) Download raw algorithm evaluation table (31.1 kB)
Best Parameters
The following table contains the best
(overall and per-method)
results for each method and evaluation measure (when the same score was achieved twice, only the smallest k is given).
The Maximum F1-Measure is complimentary in addition to the measures in the original publication.
| Algorithm | k | P@n | Adj. P@n | AP | Adj. AP | Max-F1 | Adj. MF1 | ROC AUC |
|---|---|---|---|---|---|---|---|---|
| KNN | 1 | 0.90000 | 0.89531 | 0.94545 | 0.94289 | 0.94737 | 0.94490 | 0.99437 |
| KNNW | 3 | 0.90000 | 0.89531 | 0.94167 | 0.93893 | 0.94737 | 0.94490 | 0.99343 |
| LOF | 58 | 0.90000 | 0.89531 | 0.94000 | 0.93718 | 0.94737 | 0.94490 | 0.99296 |
| LOF | 82 | 0.90000 | 0.89531 | 0.94167 | 0.93893 | 0.94737 | 0.94490 | 0.99343 |
| SimplifiedLOF | 79 | 0.90000 | 0.89531 | 0.94000 | 0.93718 | 0.94737 | 0.94490 | 0.99296 |
| SimplifiedLOF | 82 | 0.90000 | 0.89531 | 0.94348 | 0.94082 | 0.94737 | 0.94490 | 0.99390 |
| LoOP | 68 | 0.60000 | 0.58122 | 0.56777 | 0.54748 | 0.69231 | 0.67786 | 0.97746 |
| LoOP | 87 | 0.60000 | 0.58122 | 0.69655 | 0.68230 | 0.75000 | 0.73826 | 0.98498 |
| LoOP | 96 | 0.60000 | 0.58122 | 0.83293 | 0.82509 | 0.75000 | 0.73826 | 0.98920 |
| LoOP | 100 | 0.60000 | 0.58122 | 0.83626 | 0.82857 | 0.75000 | 0.73826 | 0.98732 |
| LDOF | 82 | 0.50000 | 0.47653 | 0.52024 | 0.49772 | 0.66667 | 0.65102 | 0.97277 |
| LDOF | 87 | 0.50000 | 0.47653 | 0.55126 | 0.53020 | 0.74074 | 0.72857 | 0.97653 |
| LDOF | 95 | 0.50000 | 0.47653 | 0.57565 | 0.55573 | 0.74074 | 0.72857 | 0.97840 |
| ODIN | 86 | 0.50000 | 0.47653 | 0.44354 | 0.41741 | 0.64286 | 0.62609 | 0.96620 |
| ODIN | 99 | 0.50000 | 0.47653 | 0.46027 | 0.43493 | 0.69565 | 0.68136 | 0.96854 |
| FastABOD | 5 | 0.80000 | 0.79061 | 0.60163 | 0.58293 | 0.80000 | 0.79061 | 0.97981 |
| FastABOD | 7 | 0.80000 | 0.79061 | 0.89704 | 0.89220 | 0.88889 | 0.88367 | 0.98920 |
| FastABOD | 39 | 0.80000 | 0.79061 | 0.92045 | 0.91672 | 0.88889 | 0.88367 | 0.99296 |
| KDEOS | 4 | 0.00000 | -0.04695 | 0.09088 | 0.04819 | 0.20000 | 0.16244 | 0.67887 |
| KDEOS | 5 | 0.10000 | 0.05775 | 0.08893 | 0.04615 | 0.18182 | 0.14341 | 0.68592 |
| LDF | 30 | 0.90000 | 0.89531 | 0.92704 | 0.92361 | 0.90000 | 0.89531 | 0.99155 |
| LDF | 31 | 0.90000 | 0.89531 | 0.93704 | 0.93408 | 0.94737 | 0.94490 | 0.99202 |
| LDF | 69 | 0.90000 | 0.89531 | 0.94167 | 0.93893 | 0.94737 | 0.94490 | 0.99343 |
| INFLO | 81 | 0.90000 | 0.89531 | 0.94167 | 0.93893 | 0.94737 | 0.94490 | 0.99343 |
| INFLO | 82 | 0.90000 | 0.89531 | 0.94762 | 0.94516 | 0.94737 | 0.94490 | 0.99484 |
| COF | 67 | 0.80000 | 0.79061 | 0.80419 | 0.79500 | 0.80000 | 0.79061 | 0.98732 |
| COF | 75 | 0.70000 | 0.68592 | 0.81191 | 0.80308 | 0.75000 | 0.73826 | 0.98263 |
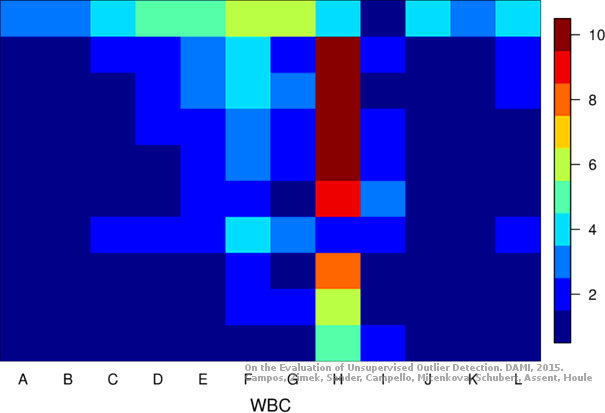
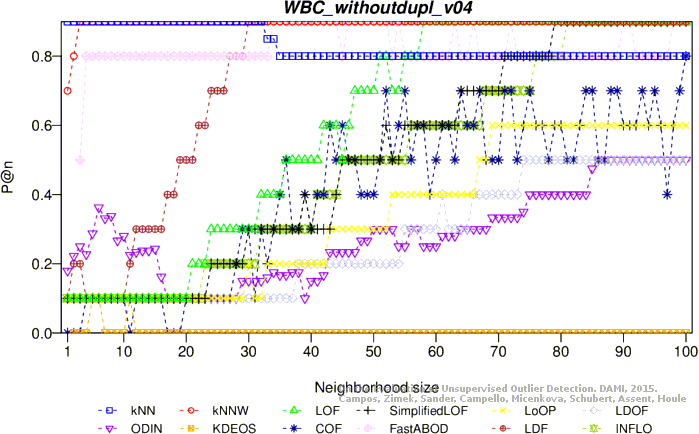
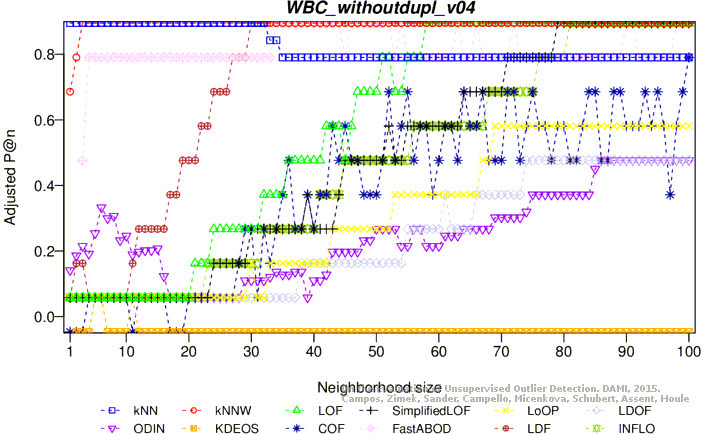
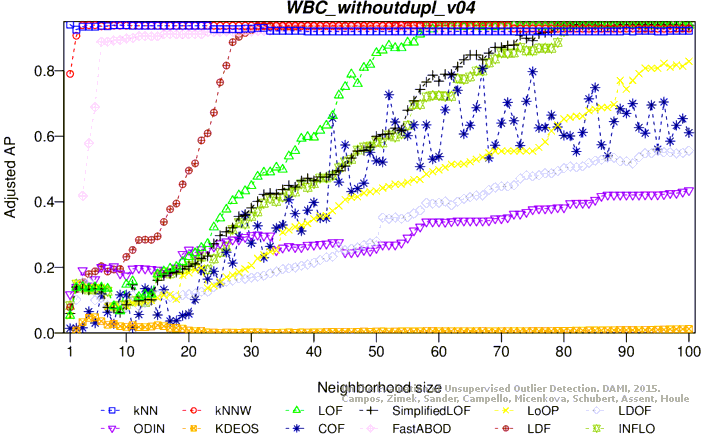
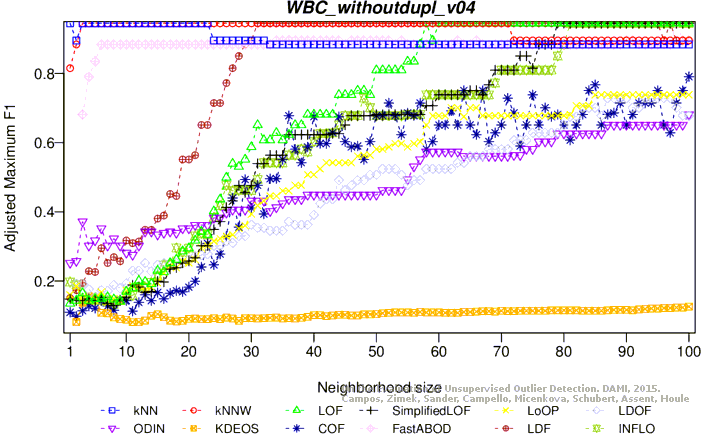
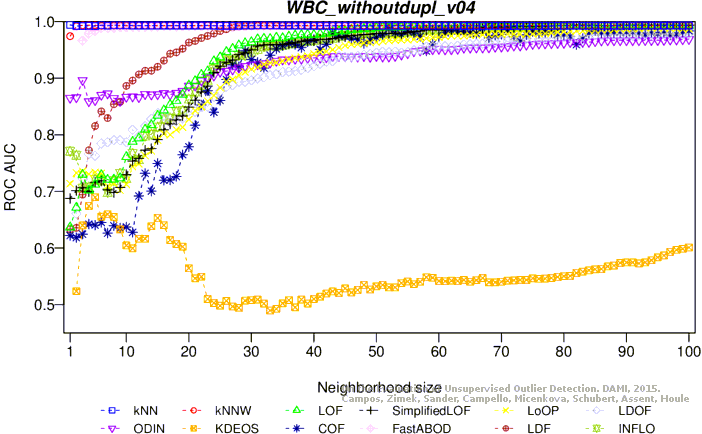
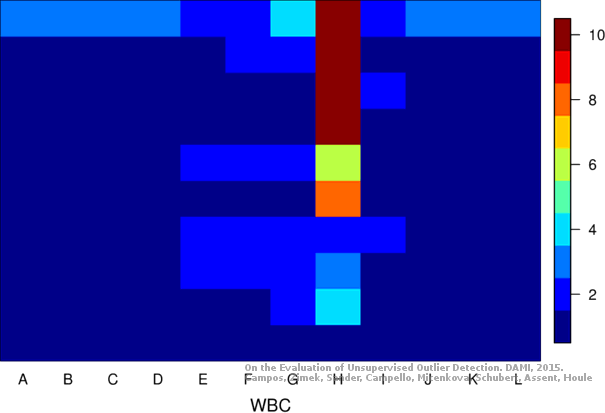
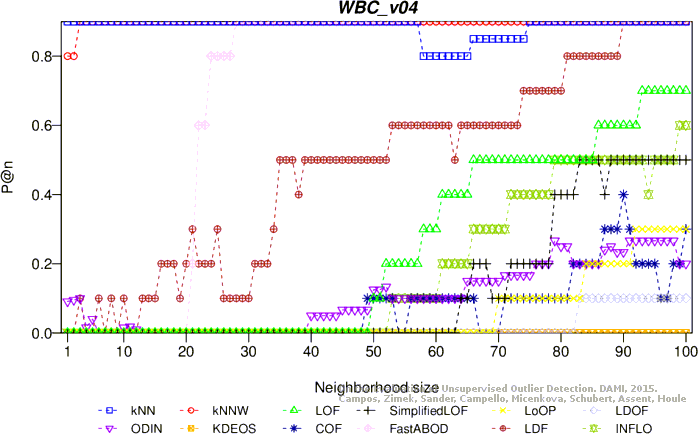
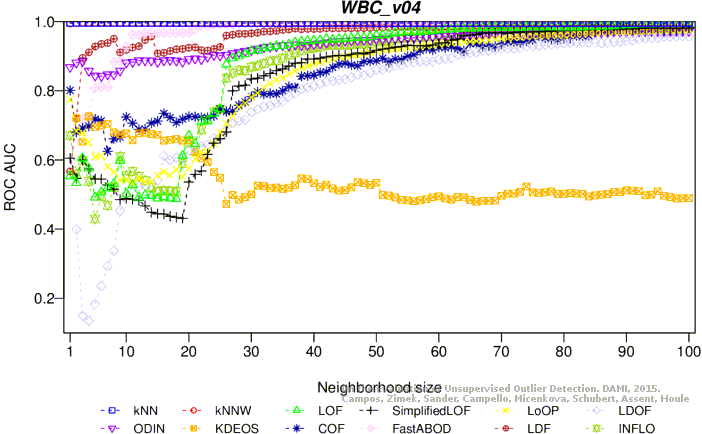
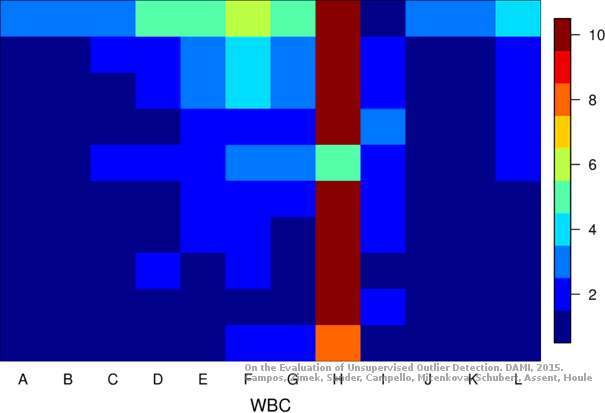
Plots
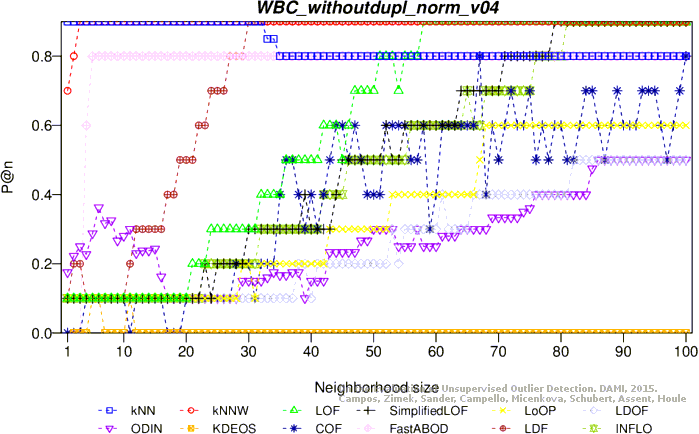
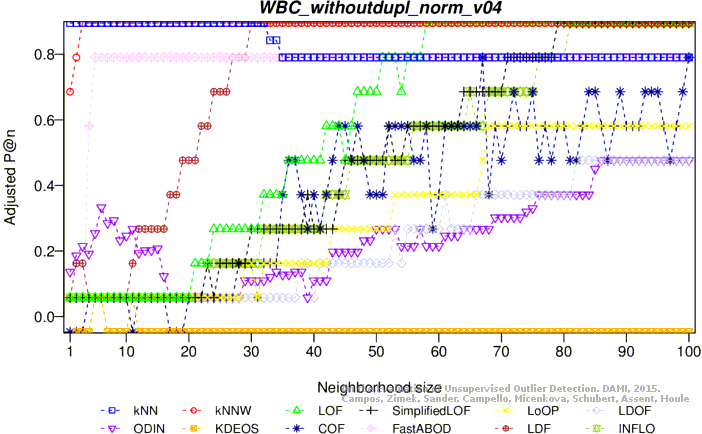
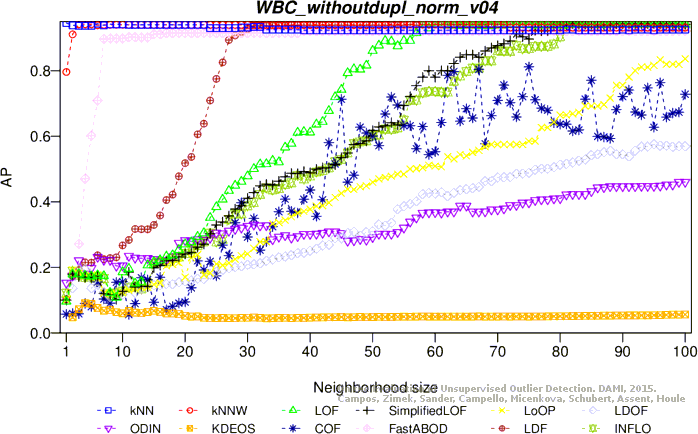
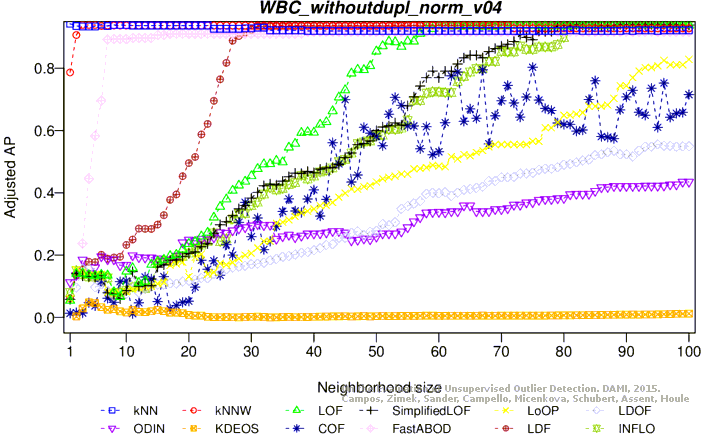


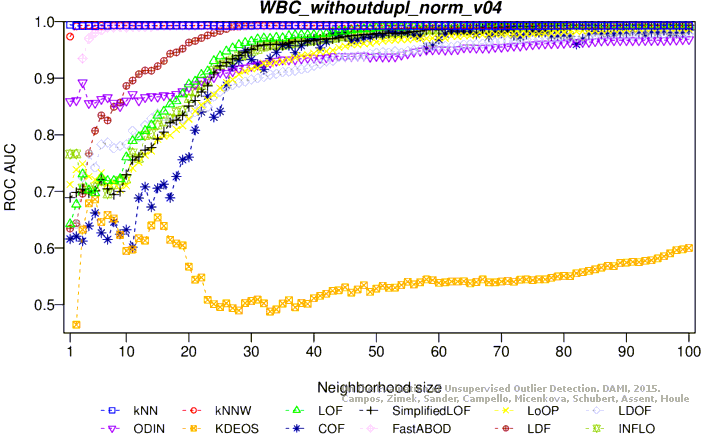
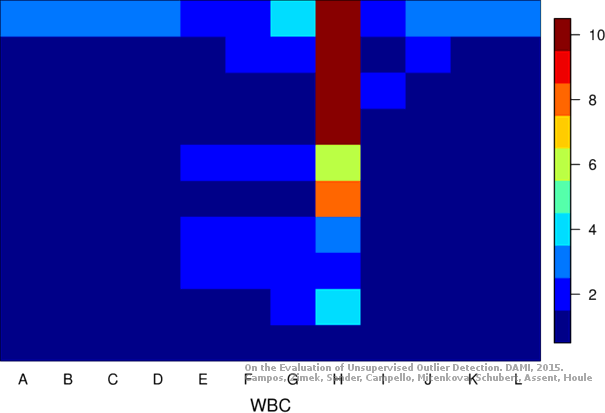
G: ODIN, H: KDEOS, I: COF, J: FastABOD, K: LDF, L: INFLO
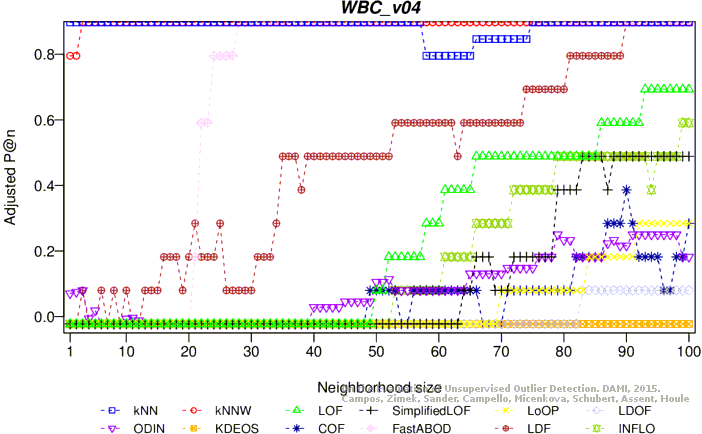
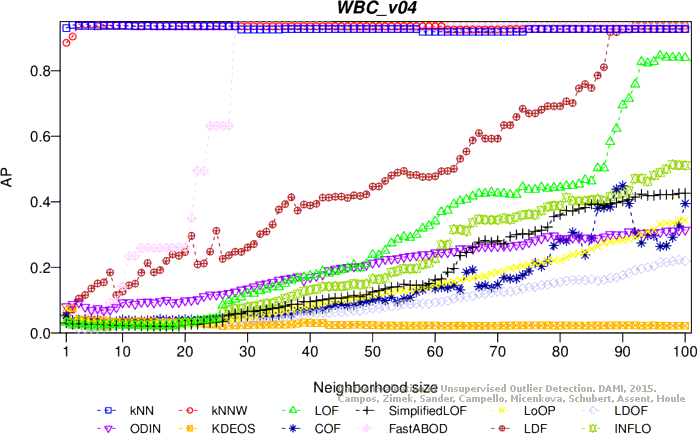
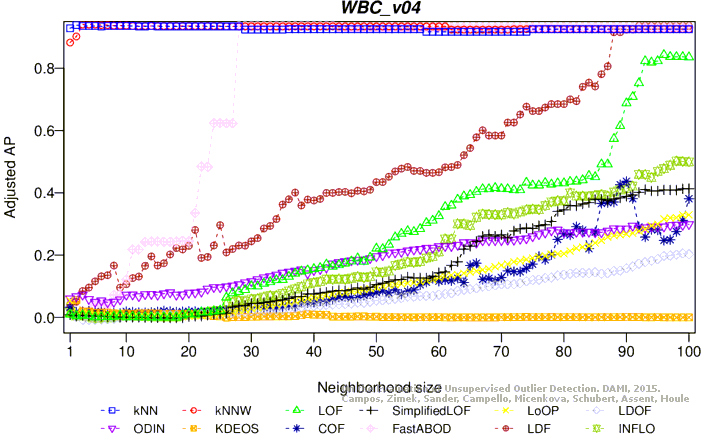
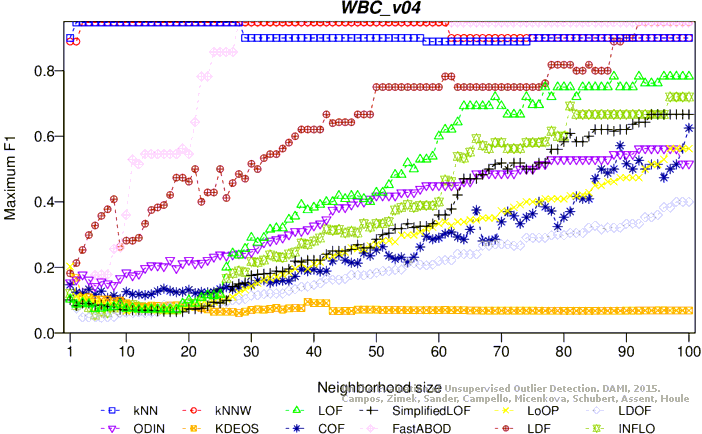
Normalized, duplicates
This version contains 9 attributes, 454 objects, 10 outliers (2.20%)
Download raw algorithm results (2.0 MB) Download raw algorithm evaluation table (38.8 kB)
Best Parameters
The following table contains the best
(overall and per-method)
results for each method and evaluation measure (when the same score was achieved twice, only the smallest k is given).
The Maximum F1-Measure is complimentary in addition to the measures in the original publication.
| Algorithm | k | P@n | Adj. P@n | AP | Adj. AP | Max-F1 | Adj. MF1 | ROC AUC |
|---|---|---|---|---|---|---|---|---|
| KNN | 1 | 0.90000 | 0.89775 | 0.94167 | 0.94035 | 0.94737 | 0.94618 | 0.99696 |
| KNNW | 2 | 0.90000 | 0.89775 | 0.94167 | 0.94035 | 0.94737 | 0.94618 | 0.99685 |
| LOF | 89 | 0.70000 | 0.69324 | 0.81939 | 0.81532 | 0.78261 | 0.77771 | 0.99144 |
| LOF | 95 | 0.70000 | 0.69324 | 0.86553 | 0.86250 | 0.81818 | 0.81409 | 0.99324 |
| SimplifiedLOF | 84 | 0.50000 | 0.48874 | 0.39691 | 0.38333 | 0.66667 | 0.65916 | 0.97793 |
| SimplifiedLOF | 100 | 0.50000 | 0.48874 | 0.45854 | 0.44635 | 0.69565 | 0.68880 | 0.98243 |
| LoOP | 93 | 0.30000 | 0.28423 | 0.29237 | 0.27644 | 0.48649 | 0.47492 | 0.97027 |
| LoOP | 99 | 0.30000 | 0.28423 | 0.32779 | 0.31265 | 0.51429 | 0.50335 | 0.97387 |
| LoOP | 100 | 0.30000 | 0.28423 | 0.33001 | 0.31492 | 0.51429 | 0.50335 | 0.97432 |
| LDOF | 85 | 0.10000 | 0.07973 | 0.17175 | 0.15310 | 0.33962 | 0.32475 | 0.94324 |
| LDOF | 100 | 0.10000 | 0.07973 | 0.20764 | 0.18979 | 0.38298 | 0.36908 | 0.95360 |
| ODIN | 99 | 0.35000 | 0.33536 | 0.30992 | 0.29437 | 0.51613 | 0.50523 | 0.97230 |
| ODIN | 100 | 0.30000 | 0.28423 | 0.31035 | 0.29481 | 0.52941 | 0.51881 | 0.97185 |
| FastABOD | 28 | 0.90000 | 0.89775 | 0.92857 | 0.92696 | 0.94737 | 0.94618 | 0.99437 |
| FastABOD | 76 | 0.90000 | 0.89775 | 0.93226 | 0.93073 | 0.94737 | 0.94618 | 0.99527 |
| KDEOS | 2 | 0.00000 | -0.02252 | 0.09027 | 0.06978 | 0.19753 | 0.17946 | 0.77432 |
| KDEOS | 7 | 0.00000 | -0.02252 | 0.07193 | 0.05103 | 0.15625 | 0.13725 | 0.84302 |
| LDF | 83 | 0.90000 | 0.89775 | 0.89865 | 0.89636 | 0.90000 | 0.89775 | 0.99459 |
| LDF | 86 | 0.90000 | 0.89775 | 0.93226 | 0.93073 | 0.94737 | 0.94618 | 0.99527 |
| LDF | 91 | 0.90000 | 0.89775 | 0.93571 | 0.93427 | 0.94737 | 0.94618 | 0.99595 |
| INFLO | 88 | 0.60000 | 0.59099 | 0.46626 | 0.45424 | 0.66667 | 0.65916 | 0.98356 |
| INFLO | 100 | 0.60000 | 0.59099 | 0.63524 | 0.62702 | 0.72000 | 0.71369 | 0.98739 |
| COF | 92 | 0.50000 | 0.48874 | 0.42228 | 0.40927 | 0.62069 | 0.61215 | 0.98468 |
| COF | 99 | 0.40000 | 0.38649 | 0.47499 | 0.46317 | 0.66667 | 0.65916 | 0.98559 |
| COF | 100 | 0.40000 | 0.38649 | 0.59103 | 0.58182 | 0.66667 | 0.65916 | 0.98784 |
Plots
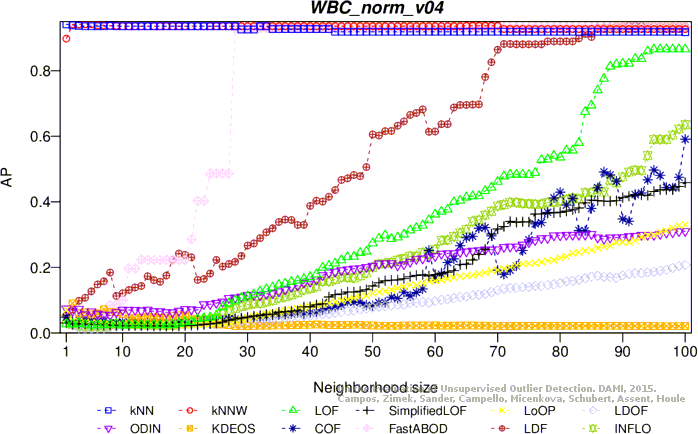
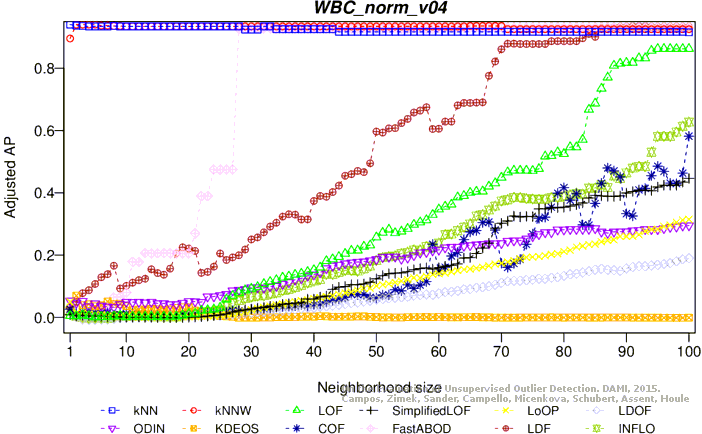

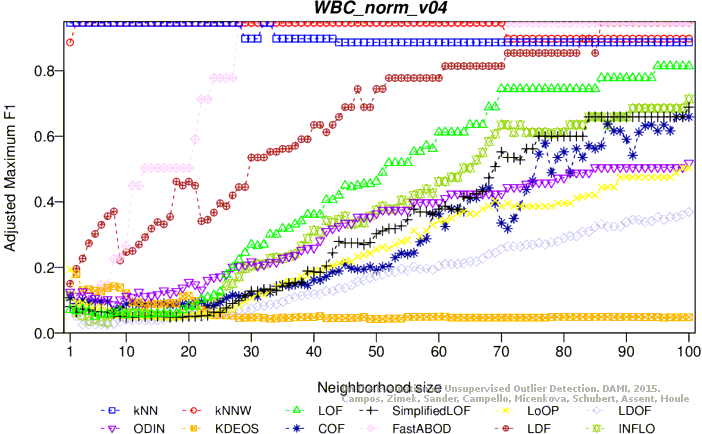
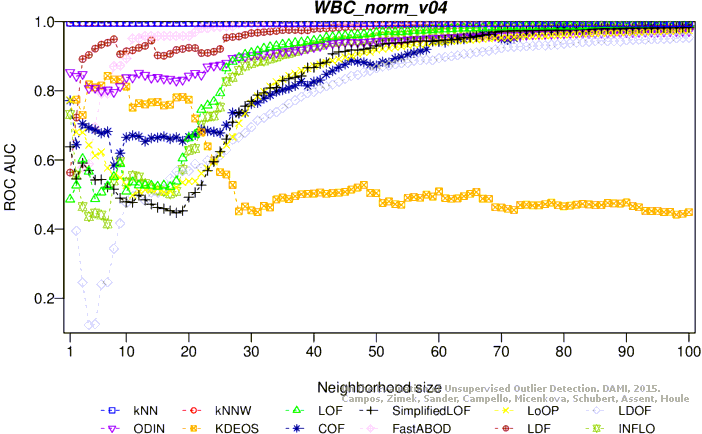
G: ODIN, H: KDEOS, I: COF, J: FastABOD, K: LDF, L: INFLO
Not normalized, without duplicates
This version contains 9 attributes, 223 objects, 10 outliers (4.48%)
Download raw algorithm results (1.6 MB) Download raw algorithm evaluation table (31.4 kB)
Best Parameters
The following table contains the best
(overall and per-method)
results for each method and evaluation measure (when the same score was achieved twice, only the smallest k is given).
The Maximum F1-Measure is complimentary in addition to the measures in the original publication.
| Algorithm | k | P@n | Adj. P@n | AP | Adj. AP | Max-F1 | Adj. MF1 | ROC AUC |
|---|---|---|---|---|---|---|---|---|
| KNN | 1 | 0.90000 | 0.89531 | 0.94348 | 0.94082 | 0.94737 | 0.94490 | 0.99413 |
| KNNW | 3 | 0.90000 | 0.89531 | 0.94167 | 0.93893 | 0.94737 | 0.94490 | 0.99343 |
| LOF | 58 | 0.90000 | 0.89531 | 0.94000 | 0.93718 | 0.94737 | 0.94490 | 0.99296 |
| LOF | 72 | 0.90000 | 0.89531 | 0.94167 | 0.93893 | 0.94737 | 0.94490 | 0.99343 |
| SimplifiedLOF | 79 | 0.90000 | 0.89531 | 0.94000 | 0.93718 | 0.94737 | 0.94490 | 0.99296 |
| SimplifiedLOF | 82 | 0.90000 | 0.89531 | 0.94348 | 0.94082 | 0.94737 | 0.94490 | 0.99390 |
| LoOP | 69 | 0.60000 | 0.58122 | 0.57491 | 0.55496 | 0.69231 | 0.67786 | 0.97793 |
| LoOP | 85 | 0.60000 | 0.58122 | 0.69655 | 0.68230 | 0.75000 | 0.73826 | 0.98498 |
| LoOP | 93 | 0.60000 | 0.58122 | 0.81627 | 0.80764 | 0.75000 | 0.73826 | 0.98873 |
| LoOP | 100 | 0.60000 | 0.58122 | 0.83626 | 0.82857 | 0.75000 | 0.73826 | 0.98732 |
| LDOF | 74 | 0.50000 | 0.47653 | 0.50457 | 0.48131 | 0.62500 | 0.60739 | 0.96995 |
| LDOF | 87 | 0.50000 | 0.47653 | 0.55581 | 0.53496 | 0.74074 | 0.72857 | 0.97700 |
| LDOF | 95 | 0.50000 | 0.47653 | 0.57565 | 0.55573 | 0.74074 | 0.72857 | 0.97840 |
| LDOF | 100 | 0.50000 | 0.47653 | 0.57640 | 0.55652 | 0.69231 | 0.67786 | 0.97793 |
| ODIN | 86 | 0.50000 | 0.47653 | 0.44354 | 0.41741 | 0.64286 | 0.62609 | 0.96620 |
| ODIN | 100 | 0.50000 | 0.47653 | 0.46027 | 0.43493 | 0.69565 | 0.68136 | 0.96878 |
| FastABOD | 34 | 0.90000 | 0.89531 | 0.93348 | 0.93036 | 0.90000 | 0.89531 | 0.99343 |
| FastABOD | 98 | 0.90000 | 0.89531 | 0.94762 | 0.94516 | 0.94737 | 0.94490 | 0.99484 |
| KDEOS | 4 | 0.00000 | -0.04695 | 0.08850 | 0.04571 | 0.19355 | 0.15569 | 0.67418 |
| KDEOS | 5 | 0.10000 | 0.05775 | 0.09053 | 0.04783 | 0.19048 | 0.15247 | 0.68967 |
| LDF | 30 | 0.90000 | 0.89531 | 0.92704 | 0.92361 | 0.90000 | 0.89531 | 0.99155 |
| LDF | 31 | 0.90000 | 0.89531 | 0.93704 | 0.93408 | 0.94737 | 0.94490 | 0.99202 |
| LDF | 68 | 0.90000 | 0.89531 | 0.94167 | 0.93893 | 0.94737 | 0.94490 | 0.99343 |
| INFLO | 81 | 0.90000 | 0.89531 | 0.94167 | 0.93893 | 0.94737 | 0.94490 | 0.99343 |
| INFLO | 82 | 0.90000 | 0.89531 | 0.94762 | 0.94516 | 0.94737 | 0.94490 | 0.99484 |
| COF | 67 | 0.70000 | 0.68592 | 0.81564 | 0.80699 | 0.76190 | 0.75073 | 0.98779 |
| COF | 100 | 0.80000 | 0.79061 | 0.62824 | 0.61079 | 0.80000 | 0.79061 | 0.98357 |
Plots


G: ODIN, H: KDEOS, I: COF, J: FastABOD, K: LDF, L: INFLO
Not normalized, duplicates
This version contains 9 attributes, 454 objects, 10 outliers (2.20%)
Download raw algorithm results (1.9 MB) Download raw algorithm evaluation table (39.0 kB)
Best Parameters
The following table contains the best
(overall and per-method)
results for each method and evaluation measure (when the same score was achieved twice, only the smallest k is given).
The Maximum F1-Measure is complimentary in addition to the measures in the original publication.
| Algorithm | k | P@n | Adj. P@n | AP | Adj. AP | Max-F1 | Adj. MF1 | ROC AUC |
|---|---|---|---|---|---|---|---|---|
| KNN | 1 | 0.90000 | 0.89775 | 0.93000 | 0.92842 | 0.90000 | 0.89775 | 0.99651 |
| KNN | 2 | 0.90000 | 0.89775 | 0.94000 | 0.93865 | 0.94737 | 0.94618 | 0.99662 |
| KNNW | 3 | 0.90000 | 0.89775 | 0.94167 | 0.94035 | 0.94737 | 0.94618 | 0.99685 |
| LOF | 88 | 0.60000 | 0.59099 | 0.58287 | 0.57347 | 0.78261 | 0.77771 | 0.98739 |
| LOF | 93 | 0.70000 | 0.69324 | 0.82721 | 0.82332 | 0.76190 | 0.75654 | 0.99302 |
| LOF | 96 | 0.70000 | 0.69324 | 0.84644 | 0.84298 | 0.78261 | 0.77771 | 0.99347 |
| SimplifiedLOF | 83 | 0.50000 | 0.48874 | 0.37830 | 0.36430 | 0.58333 | 0.57395 | 0.97545 |
| SimplifiedLOF | 94 | 0.50000 | 0.48874 | 0.41907 | 0.40599 | 0.66667 | 0.65916 | 0.98086 |
| SimplifiedLOF | 100 | 0.50000 | 0.48874 | 0.42621 | 0.41329 | 0.66667 | 0.65916 | 0.98131 |
| LoOP | 92 | 0.30000 | 0.28423 | 0.29289 | 0.27696 | 0.47368 | 0.46183 | 0.97072 |
| LoOP | 97 | 0.30000 | 0.28423 | 0.33470 | 0.31971 | 0.56250 | 0.55265 | 0.97500 |
| LoOP | 99 | 0.30000 | 0.28423 | 0.34390 | 0.32913 | 0.56250 | 0.55265 | 0.97590 |
| LDOF | 83 | 0.10000 | 0.07973 | 0.16195 | 0.14307 | 0.30508 | 0.28943 | 0.93919 |
| LDOF | 98 | 0.10000 | 0.07973 | 0.21915 | 0.20156 | 0.40000 | 0.38649 | 0.95653 |
| LDOF | 99 | 0.10000 | 0.07973 | 0.22307 | 0.20557 | 0.40000 | 0.38649 | 0.95743 |
| ODIN | 79 | 0.26667 | 0.25015 | 0.29713 | 0.28130 | 0.52941 | 0.51881 | 0.96757 |
| ODIN | 92 | 0.26667 | 0.25015 | 0.30259 | 0.28688 | 0.56250 | 0.55265 | 0.97083 |
| ODIN | 98 | 0.26667 | 0.25015 | 0.31229 | 0.29680 | 0.56250 | 0.55265 | 0.97252 |
| ODIN | 100 | 0.20000 | 0.18198 | 0.31433 | 0.29889 | 0.51613 | 0.50523 | 0.97230 |
| FastABOD | 28 | 0.90000 | 0.89775 | 0.93846 | 0.93708 | 0.94737 | 0.94618 | 0.99640 |
| KDEOS | 2 | 0.00000 | -0.02252 | 0.07635 | 0.05555 | 0.16842 | 0.14969 | 0.72083 |
| KDEOS | 4 | 0.00000 | -0.02252 | 0.03985 | 0.01823 | 0.10870 | 0.08862 | 0.72568 |
| LDF | 90 | 0.90000 | 0.89775 | 0.92571 | 0.92404 | 0.90000 | 0.89775 | 0.99572 |
| LDF | 92 | 0.90000 | 0.89775 | 0.93704 | 0.93562 | 0.94737 | 0.94618 | 0.99617 |
| INFLO | 97 | 0.50000 | 0.48874 | 0.49988 | 0.48861 | 0.72000 | 0.71369 | 0.98671 |
| INFLO | 98 | 0.50000 | 0.48874 | 0.51335 | 0.50239 | 0.72000 | 0.71369 | 0.98694 |
| INFLO | 99 | 0.60000 | 0.59099 | 0.51166 | 0.50066 | 0.72000 | 0.71369 | 0.98694 |
| COF | 90 | 0.40000 | 0.38649 | 0.44936 | 0.43696 | 0.51613 | 0.50523 | 0.97950 |
| COF | 100 | 0.30000 | 0.28423 | 0.39468 | 0.38104 | 0.62500 | 0.61655 | 0.98311 |
Plots

G: ODIN, H: KDEOS, I: COF, J: FastABOD, K: LDF, L: INFLO